
WHO ARE WE?
We are a group of data scientists that mainly relies on data for business and social inferences. At Daventure, we deeply care about helping you tackle your biggest challenges and give you the competitive edge you need to strive. Our relationship is never transactional, our relationship is and always will be about building long lasting partnerships enabling your long-term successes.
Our Vision
Our central focus is to offer the most suitable platform where small and medium organizations can satisfy their thirst for answers in their data.
Consulting for multiple industries

Energy & Utility
We are serving all types of energy and utility companies including Investor-owned utilities, Public (municipality-owned) and Electric cooperatives.

Telecom
The telecom industry is rapidly evolving. Staying ahead requires a powerful data platform with real-time monitoring, geolocation, predictive analytics, and actionable insights.

Finance
AI has played a major role in the finance world. It can analyze millions of data in no time to improve the outcomes or goals of a company.

Logistics
With the advancements in computational power of large amount of data, the transportation and logistics industry are using this capability to enhance their decision making process.

Retail
Big and small businesses nowadays to better target their audiences are relying on ML algorithms to determine customers' tendencies.

Healthcare & Wellness
This industry has many machine learning applications accross the board that play a key role in many health-related areas.

WHAT WE DO?
We put in practice all four data analytics processes to ensure our customers are rendered the most appropriate solution for their unique business needs.

The analysis of historical data to understand trends and evaluate metrics over time to yield useful information and ready the data for further analysis with the end goal to answer the question “What happened”.
The analysis of historical data to comprehend the root causes of events and behavior. It drills into the data to uncover potential patterns outside of the existing data sets to answer the question “Why did it happen?”
The analysis of current data and historical data to forecast different activities, customer behaviors, and future trends with the objective to predict “What could happen in the future”. It leverages statistics, data modeling, machine learning and artificial intelligence
The analysis of data to showcase viable best outcomes to events given some parameters to take advantage of a future opportunity or mitigate a future risk. It seeks to answer the question “How should we respond to those potential future events?”
The amount of data collected has rapidly grown in recent days and companies struggle to keep up with an efficient use of their data known to be unorganized and troublesome to manage. That’s exactly where we step in to help address those rising challenges, leveraging data science tools. Data science is a discipline of study that applies a scientific approach to reveal insights from data; it is the umbrella designation that covers all statistical study of data.
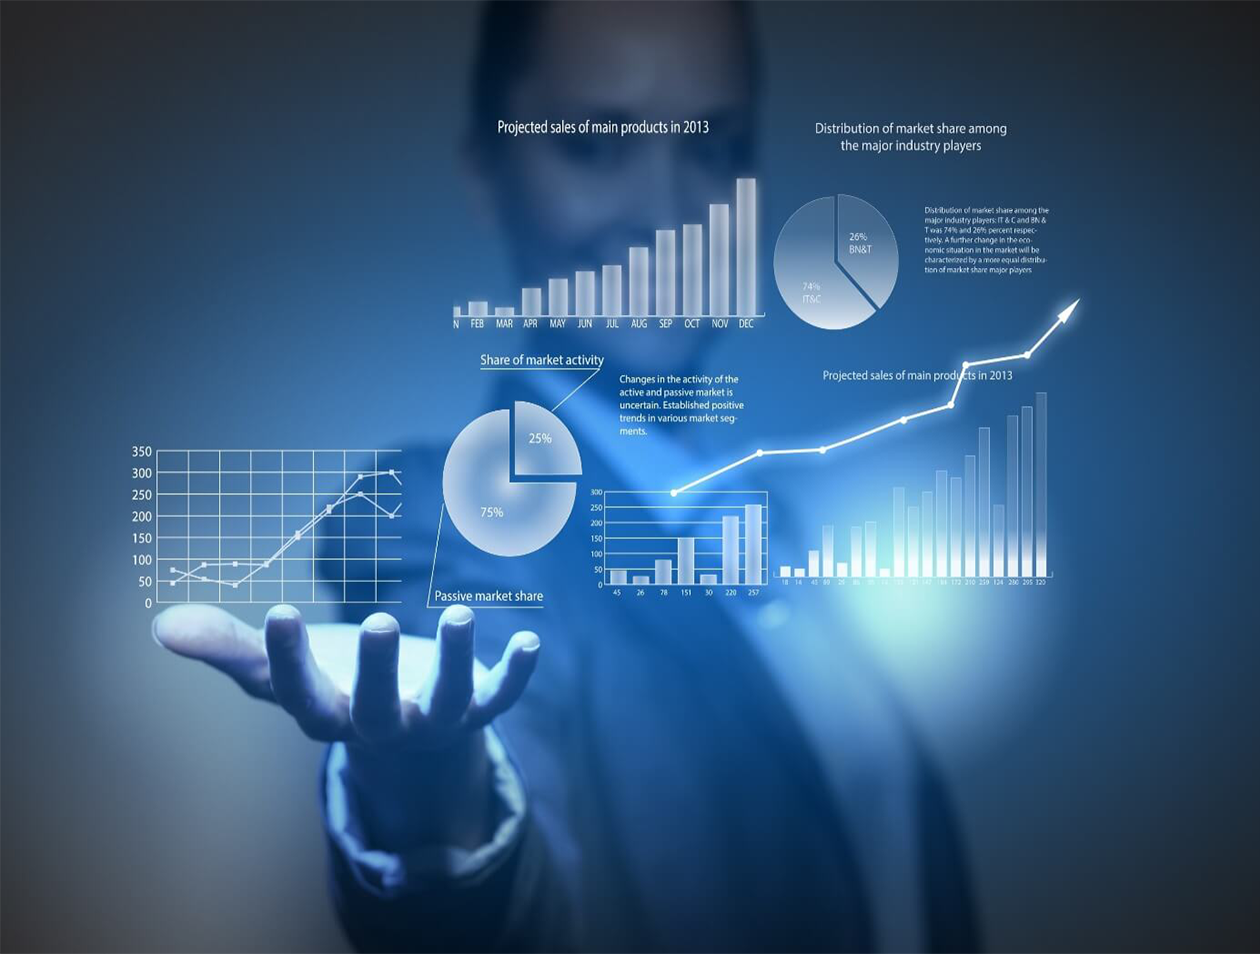
Data visualizations make your vast amounts of data more accessible and understandable, using charts and graphs to tell stories and answer questions about your business. Our analytics consultants can help and put their diverse industry experience to work for your company.
Data visualisation processes:
-

Visualize
-

Prepare Data
-

Generate Report
-

Share
-

Collect Data

What happened and how did it happen?
Business intelligence answers the questions “what” and “how” so you can replicate what works and change what does not. We place data into a visual context by building beautiful and easy to comprehend reports, leveraging charts, graphs, tables, and other easy to comprehend forms. The visualization makes explicit the trends, correlations, and patterns that might not be noticed in text-based data. Business owners can use BI outputs to make changes to current operations by streamlining workflow through better communication, technologies and procedures.
Why did it happen?
Business analytics answers the question “why” so it can make more educated predictions about what will happen; it helps to predict the future health of your business and other areas of interest. It uses data mining, modeling and machine learning to determine the likelihood of future outcomes. With BA, you can anticipate developments and make the changes necessary to succeed.

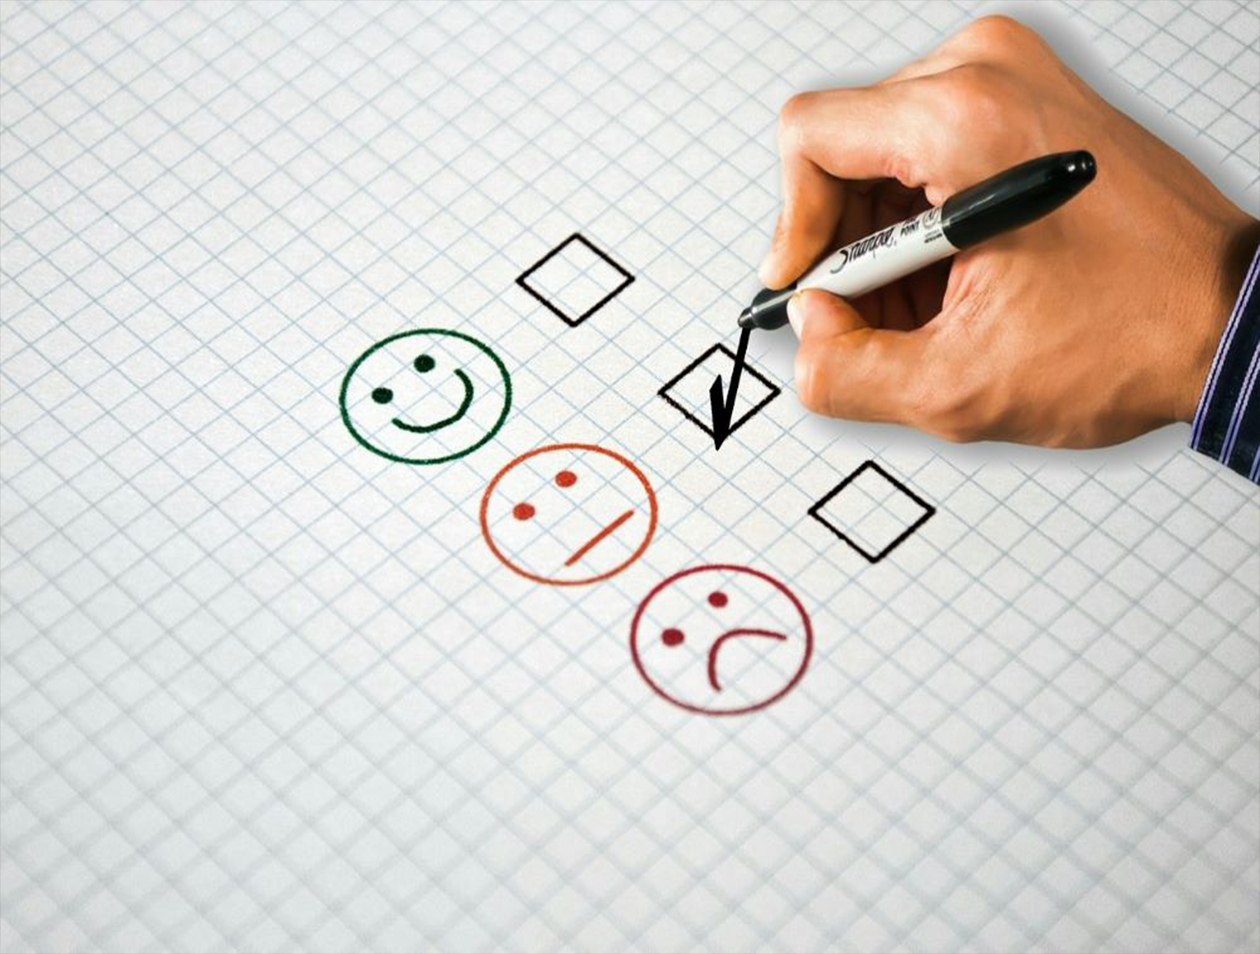
We computationally help identify and categorize opinions expressed in a piece of text in order to determine whether the writer's attitude towards a particular topic, product, etc. is positive, negative, or neutral.
Sentiment analysis is a powerful tool that can be used for social media monitoring, brand monitoring, customer support analysis, customer feedback analysis and market research.
- I admire the way you design for new website → positive
- My experience driving the new version of the car is awful → negative
- I am indifferent when it comes to the taste of their new dish → neutral
Examples:
What is likely to happen?
Artificial Intelligence relies on machine learning, which is a branch of data science that allows computers to learn and improve from experience to do predictions without being programmed. It uses past & current data to predict future trends on both quantitative variables and qualitative variables. Organizations are increasingly looking for ways to anticipate customer behavior patterns and business outcomes to steer their operations in the right direction.
Regression
If you are going to use a passage of Lorem Ipsum, you need to be sure there isn’t anything hidden in the middle of text.
Classification
We empower our customers to forecast the likelihood of the occurrence of certain events or behaviors such as fraud detection, a customer defaulting on their loan payments, and a customer becoming a churner (i.e., stop subscription).
We establish an algorithm that predictively helps classify a data point into some binary class (yes or no), multinomial class (satisfied, indifferent, unsatisfied) and ordinal class (e.g., bad, good, better, excellent) based on historical data


Identify/ Formulate Problem

Data Preparation

Data Exploration

Transform & Select

Build Model

Validate Model

Deploy Model

Evaluate/Monitor Results
We assist our customers from sampling to the estimation of the population parameters. We help select the probability sampling technique that fits each specific need of our customers.
We help our clients to validate or invalidate tentative relationships between two or more variables. A hypothesis is a statement that we seek to validate or invalidate through analytics.
Makes an inference about a fixed population parameters of interest, such as a mean, a standard deviation, a parameter in a family of distribution or regression coefficient.
Example 1: There’s 95% confidence the mean height of all men in Texas is between 168.8cm and 181.2cm. In this case, the mean height of the sampled data is 175cm; and the calculated 95% CI is (168.8cm, 181.2cm)
Forecasts or predicts the value of a random variable.
Example 2: a meteorologist predicts with 90% confidence that the amount of rainfall tomorrow will be between 1 to 2cm.
Estimate a region in a population that contains at least P% of the population values.
Example 3: Want to be 90% sure that the interval captures at least 99% of the population
Example 4: The manufacturer randomly selects 100 light bulbs and tests how long they burn. After the experiment, he is 95% confident that at least 95% of all burn times will fall between 1060 to 1435 hours. If this interval is wider than the requirements of the manufacturer’s clients, the process may produce excessive defects.
Forecasts or predicts the value of a random variable.
Example 2: a meteorologist predicts with 90% confidence that the amount of rainfall tomorrow will be between 1 to 2cm.